
Special to WorldTribune, May 2, 2022
Defend the Free Press: Receive a Free Financial Gift
MARKET Watch
by Romulus at Backpack Trader
Market cycles take different forms.
There are average durations and lengths and sometimes bull and bear markets take on spectacular configurations that blow away all expectations. Studying previous events gives us the best opportunity to gauge what might be coming next.
The most explosive bull market of my career (and the biggest in human history) was the dot-com mania. The five-year move starting in early 1995 was a unique market phenomenon filled with instant fortunes, early-stage game-changing companies, and lots of nonsense.
Grow Wealth, Not Risk. Trade alongside a 27 year hedge fund veteran
Despite kicking off in January of 1995, the broad public didn’t begin getting involved until 1997 and 98. It took a few years for the hype to spread and the Wall Street new product generation machine to seep into general society. The seep quickly turned into a gusher, though, and then it was on like Kong.
There are a lot of firms that were created during that mania that are no longer around. A few survived and went on to become the largest companies in the world. Trading in stocks like Amazon and Yahoo was like going on a ride to the moon. Hyper-jumps to the upside followed by sudden return trips to earth. Then the process would start all over again a few months later.
More and more people get sucked into the upside move of any bull market. The crowd grows. As it grows members of the crowd lose their fear and gain confidence in the prospects of further gains. New products are created that allow more active participation from the public and promotion of the products and the overall viability of the market increase. Obviously, this doesn’t go on forever, but it is a sight to behold when it is unfolding.
The dot-com mania took place on the Nasdaq stock market, which is where all the new internet companies were listed. There were several meaningful corrections in the Nasdaq until the all-time high in March of 2000. The first was a 19.5% downside hit in July of 1996. The market was trading at a new all-time high just three months later, however, with a solid rally lasting all the way to January. A 22% correction swept through the tech stocks then and that shook out a lot of early traders.
The next six months saw an amazing 55% pop. This was when the public started getting on board. There was a stock that is still with us today, Cisco Systems, that became the poster child for dot-com trading. CSCO was trading for $1.97 a share in early 1995. The stock hit $82 when the bubble popped in March of 2000. A little more than 10x, huh?
Club Romulus: Where knowledge plus action equals profit
I knew a trader back then who was all over the dot-com stocks and CSCO was one of his favorite companies. He showed me something simple that I used for the next two years to make money in CSCO stock. Every time CSCO fell at least 20% from a recent new high, buy it. I did that. Sometimes the stock would rebound right away, other times it would fall another 10%, but it hit new highs within a few months.
In April of 2000, CSCSO broke decisively below the 21-week moving average, something that hadn’t happened since 1994. I was already very leery of tech stocks by then, but that huge break on monster volume was enough to keep my hands in my pockets and my money in my account.
CSCO proceeded to drop 90% over the next 30 months.
The Chinese stock market was another bubble that came to an unfortunate end, but trading was lively and profitable during the run.
Like so many equity markets around the world, the Chinese stock market peaked in October of 2007 (I will use FXI, the ETF for the Chinese stock market, as the proxy for this explanation). The S&P 500 went up about 135% from the 2003 lows to the October 2007 highs. The Chinese stock market went up almost 400%! FXI saw four corrections of 15% or more during the run, each time with new highs seen within five months or less.
Each time, until the end that is.
The first significant break below the 21-week moving average took place in January of 2008, then it was all downhill from there. FXI fell 73% a year after putting in an all-time high.
The 21-week moving average does seem to be a valuable differentiator between bull markets/bubbles and something different. That something different doesn’t always mean a terrible bear market. A break below the 21-week can turn ugly, but it can also lead to long periods of consolidation. My studies suggest it rarely leads to a powerful resumption of the bull market, however, and a powerful bull market is what investors and most traders need to make consistent returns.
After falling below this important line in February of 2020 (covid crash) the S&P 500 reclaimed the 21-week MA by the middle of May and it stayed above it until three months ago. As this is an intermediate to longer-term indicator, it should be viewed with a longer-term perspective. The full force of this current bear market is yet to be realized.
Right before the financial crisis began, the S&P 500 ran to 1575, and was less than nine off that high seven months later. The real damage came five months later, with a 28% downside smash in the fall, in just two weeks. In the dot-com crash, the S&P was still only 10% off the highs 10 months after the peak. The real selling came a little later.
Why am I carrying on about bull and bear markets and bubbles and crashes?
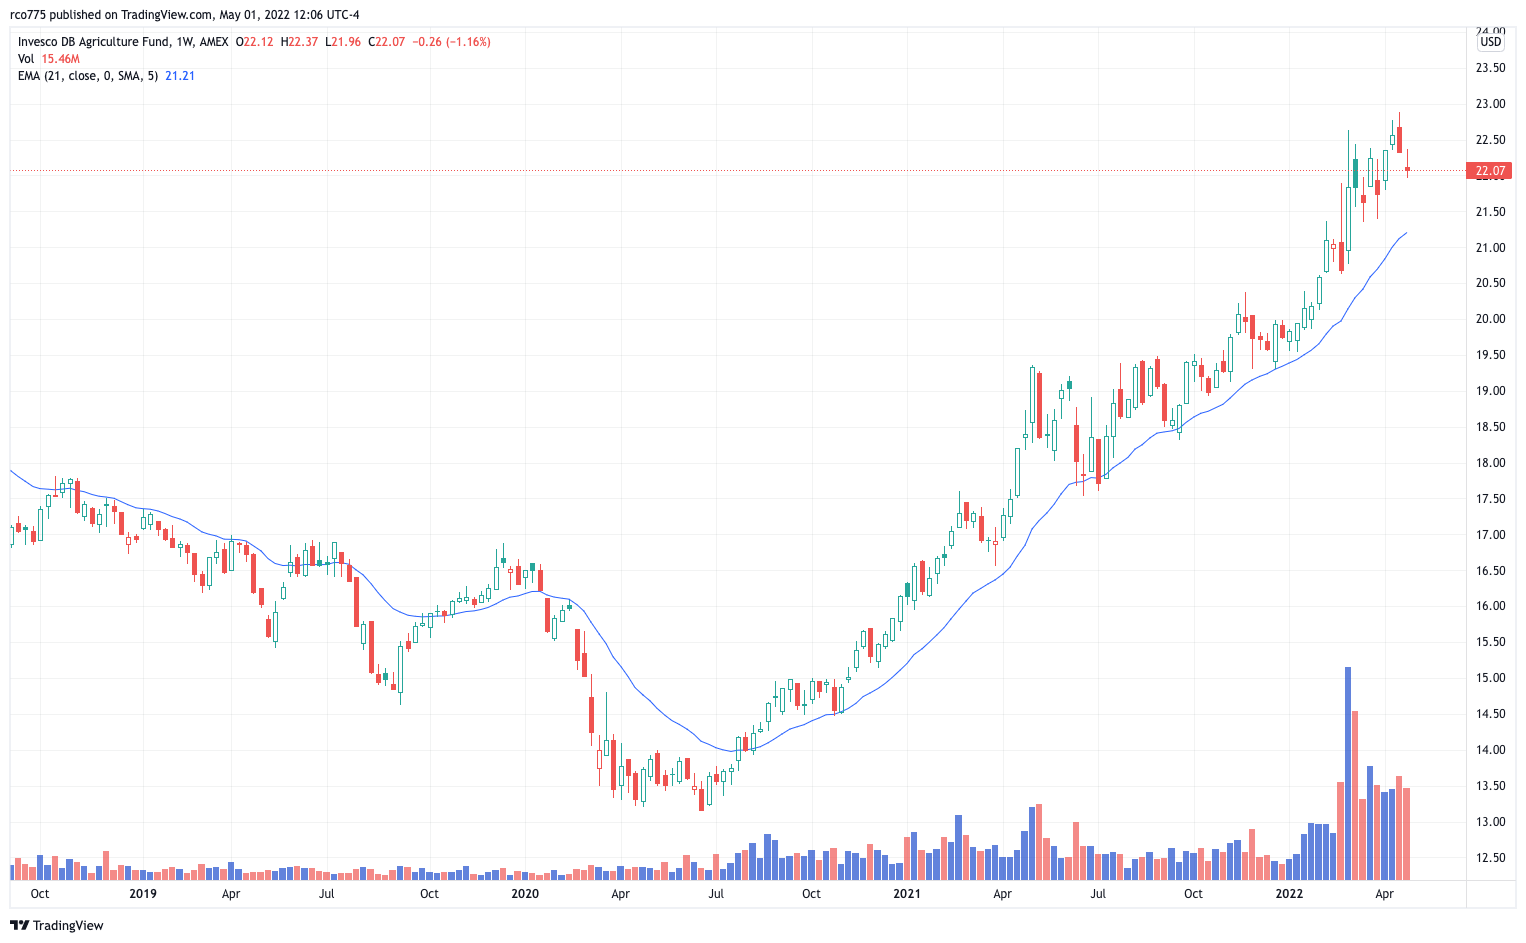
Earlier this year I speculated that we might be in the early stages of a commodity super-cycle. I highlighted the CORN, WEAT, SOYB, DBC and DBA exchange traded funds as ways to participate in the bull run. They are all up since that mention on February 22nd. As oil is the main driver here, it is worth noting that oil touched the 21-week moving average (blue line) for the first time since the end of last year. That was also a strong area of support.
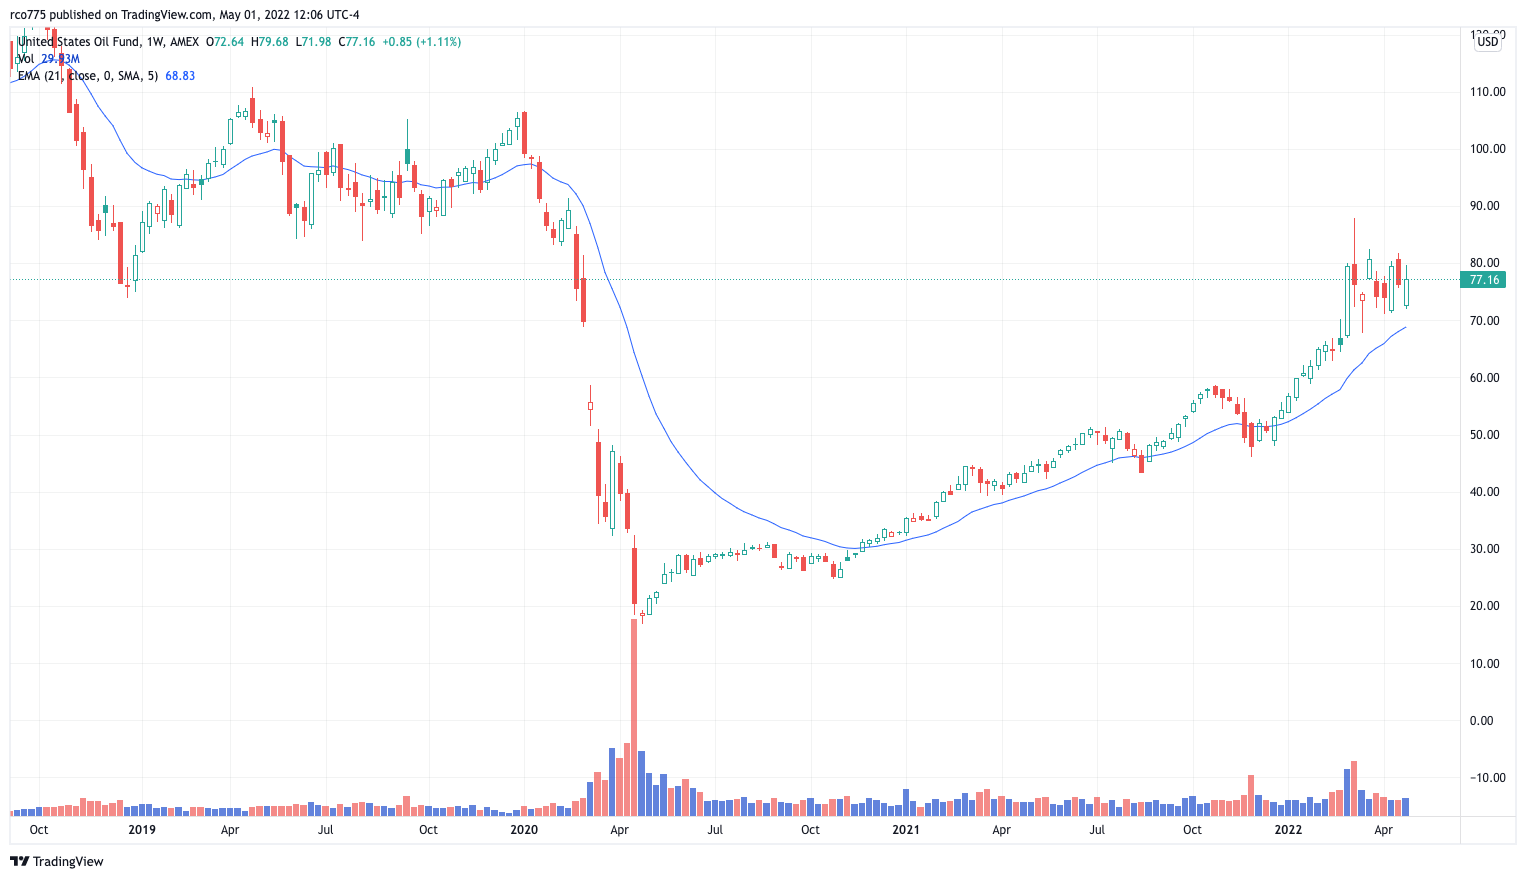
With the rest of the commodity complex far above the 21-week MA, it is a higher risk probability to chase them up here. The next time DBA touches the 21-week could be a decent entry point. This may not be a super-cycle, but the bull market in commodities looks like it can run for a bit longer.
Related: Romulus Report: Inflation and a coming commodities supercycle? December 10, 2021
Remember:
Wealth, like Rome, cannot be built in a day. But, like Rome, it can be lost in a day.
Watch for future announcements from Romulus about profitable market moves, important indicators, and major market swings. For trading education, mentoring, or to beat the markets with Romulus’ trading group, contact [email protected].
About the author:
In his real-life existence, Romulus started on Wall Street in 1994 and traded for a hedge fund for 13 years. Since 1994, he has called every major market top ahead of time and profited from them, including the break of the Dot-com bubble in 2000, the market crashes of 2008 and 2009, and the Covid crash of 2020. Since 2020 he has been working with investors and traders to actively manage their portfolios by growing wealth, not risk, as a teacher and mentor working with Backpack Trader, a stock trading educational company.
Romulus Report: Market cycles, commodities supercycle added by Investigative Editor on
View all posts by Investigative Editor →