
by WorldTribune Staff, June 13, 2023
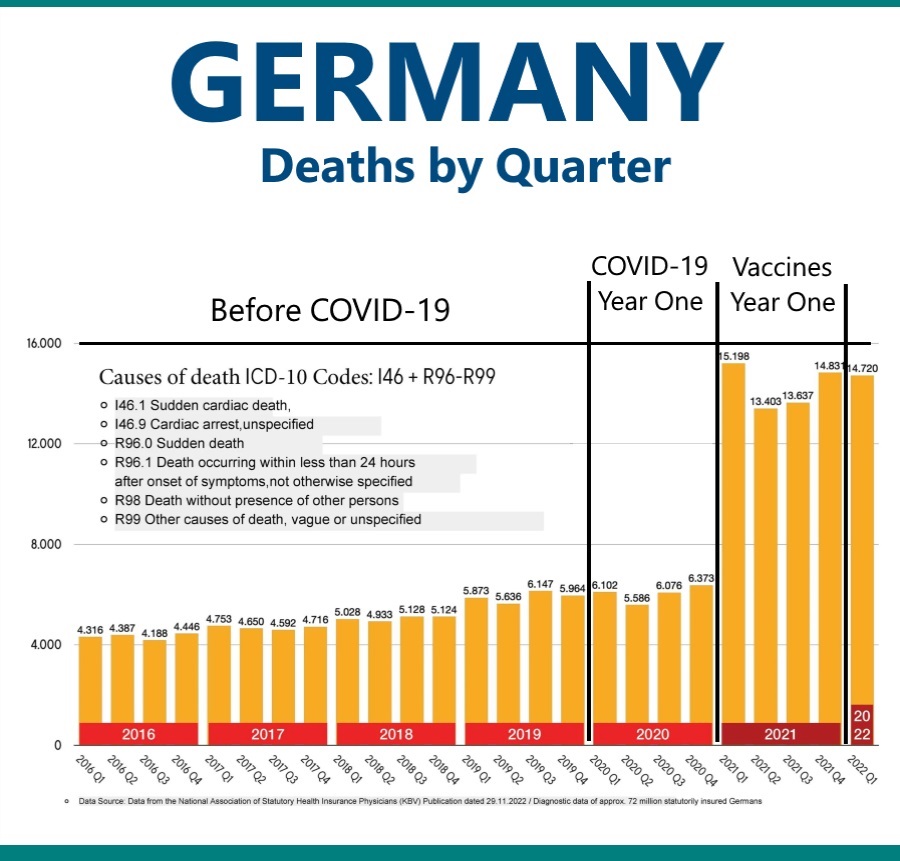
A chart from Germany’s National Association of Statutory Health Insurance (KBV) that breaks down deaths by quarter from 2016 to the first quarter of 2022 shows a huge spike in deaths after the rollout of the Covid vaccines.
The chart shows that deaths during the pandemic in 2020, before the shots were distributed, were only slightly higher than the averages from previous years.
But, from the first quarter of 2021 to the first quarter of 2022, deaths for each quarter were more than double the yearly average.
Membership . . . . Intelligence . . . . Publish
One chart says it all: How do you explain all these deaths? added by Editor Two on
View all posts by Editor Two →